Daton Alerts
Stay informed and up-to-date with the latest Daton Alerts, providing valuable insights and notifications on important developments in the world of data management and integration.
Daton Alerts
Stay informed and up-to-date with the latest Daton Alerts, providing valuable insights and notifications on important developments in the world of data management and integration.
In Daton, the Alerts Panel acts as a one-stop shop for managing issues faced in the integrations, making it easier to identify and resolve them. If you deal with a considerable number of integrations you'll appreciate the time-saving advantages provided by the Alerts Panel in streamlining your data management workflow.
What are Alerts?
Alerts are automatic messages generated to notify you about any issues in the tables in your Daton integrations. These alerts highlight problems such as failing tables, integration errors, or warnings and provide resolution. Unlike email notifications, alerts focus specifically on identifying and addressing potential problems within Daton integrations, rather than account-level issues. You may receive email notifications regarding new alerts that matter most to you, depending on your Notification Settings.
Types of Alerts in Daton
This section will simplify your experience, ensuring you can efficiently navigate and respond to various scenarios within Daton Alerts.
Action Required
As the name suggests, these errors demand action from the users to resolve. These alerts signify that one or more tables are failing and require immediate action from the user (you) to be fixed. Addressing these alerts promptly is crucial to maintaining proper data synchronization and integration. These alerts already dictate the resolution component.
Action:
- Users are required to take immediate steps to resolve the issues highlighted by these alerts.
- Follow the instructions in the Resolution message to fix the problem.
- Once the problem is resolved, wait for your next scheduled sync or initiate a re-sync by clicking on the Sync Now button in the respective integration page.

Daton Alerts
These alerts indicate that the Daton team is aware of these issues and is proactively fixing them. If there is anything urgent, please reach out to us at support@sarasanalytics.com.
Action: Daton's support team takes charge of fixing the identified problems.

Warnings
Warnings highlight auto-recoverable temporary errors that may impact the data integration process. While not critical, being aware of these warnings is essential for maintaining a smooth data integration process.
Action: Sit back and relax as Daton automatically recovers from these errors.
Configuring Alerts
Data Delay notifications are integration-specific alerts. Activating Data Delay for an integration enables you to receive real-time email notifications and an overall view of all your errors across all integrations in the alerts panel. It's important to note that this feature applies only to the Active integrations in your Daton Account, meaning integrations that are not paused or deleted.
Types of Alert Toggles
Daton offers multiple types of alerts that users can turn on or off, based on their preferences and requirements. These toggles provide granular control over the types of issues you’d like to monitor. Below are the available alert types:
Action Required
Daton detects when action is required on your part to ensure data continues populating. These actions could include:
-
Re-authentication: Refresh tokens, depending on the connector, expire after a certain period and can no longer be used to generate a new access token. In such cases, you will be prompted to re-authenticate to restore access.
- Permission Updates: Some APIs require specific permissions to fetch data from their servers. If permissions are missing or insufficient, you will be asked to provide the necessary permissions.
Consecutive Errors
Daton detects when a table repeatedly fails with the same error message. These errors can occur due to issues at either of the following stages:
-
Source Stage: Errors that arise while retrieving data from the source system.
- Destination Stage: Errors that arise during data loading into the destination warehouse.
Long Running Job
Daton identifies where a table fails to provide data due to an unusually long-running job. This issue may arise from delays within the Daton pipeline, often caused by high data volume, source or destination latency, or temporary performance bottlenecks.
SLA Breached
Daton detects when a table is not updated with the latest data. Timely notifications are sent, allowing users to promptly get in touch with the Daton team.
Note:
- By default, Action Required alert is enabled for all users.
- Long Running Job and SLA Breached alerts are currently turned off and cannot be enabled at this time.
Activating Alert Notifications
Daton offers you the scope to turn on these notifications for each type of alert individual integration, by source type as well as by warehouse type. These can be conveniently activated in through two methods:
- Selecting multiple integrations individually
- Selecting multiple integrations using filter
Daton allows you to select multiple integrations at once, saving time and effort to activate your Data Delay Notifications. Additionally, the ability to filter by Source Type and Warehouse Type further enhances the process by enabling you to target specific integrations for notification activation and makes sure that no integration is missed.
By Selecting Multiple Integrations Individually
Steps to activate Data Delay Notifications by Selecting Multiple Integrations individually:
- On the Notification Settings page, click the Configure alerts tab.
- In the search bar, type the specific integration name for which you want to receive the alerts.

- Select the desired integration, click on the Actions dropdown list, and select Activate.

- You will receive a popup that says Status Changed Successfully and will observe the status updated as Enabled in the UI.

You will now receive real-time email notifications corresponding to this integration and the same will be reflected in the Alerts panel.
By Selecting Multiple Integrations Using Filter
The integration selection in Data Delay settings has an interesting feature that allows you to target specific integrations while activating them. To perform this, you may require the integration name, source or warehouse type, or combination of any two or more of them.
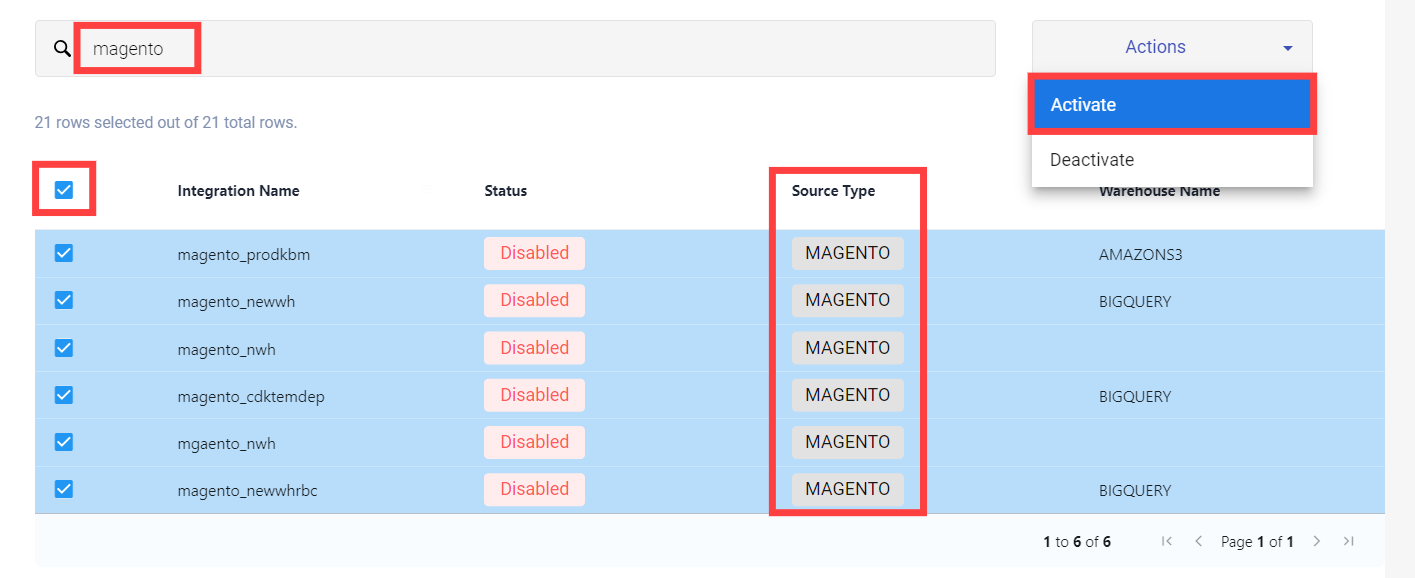
Filtering by Source Type
This action is performed when you need Alert notifications for all the active integrations of a particular Source Type.
- This can be performed by typing the desired Source Type in the search box at the top of the Data Delay Tab on the Notification Settings page.

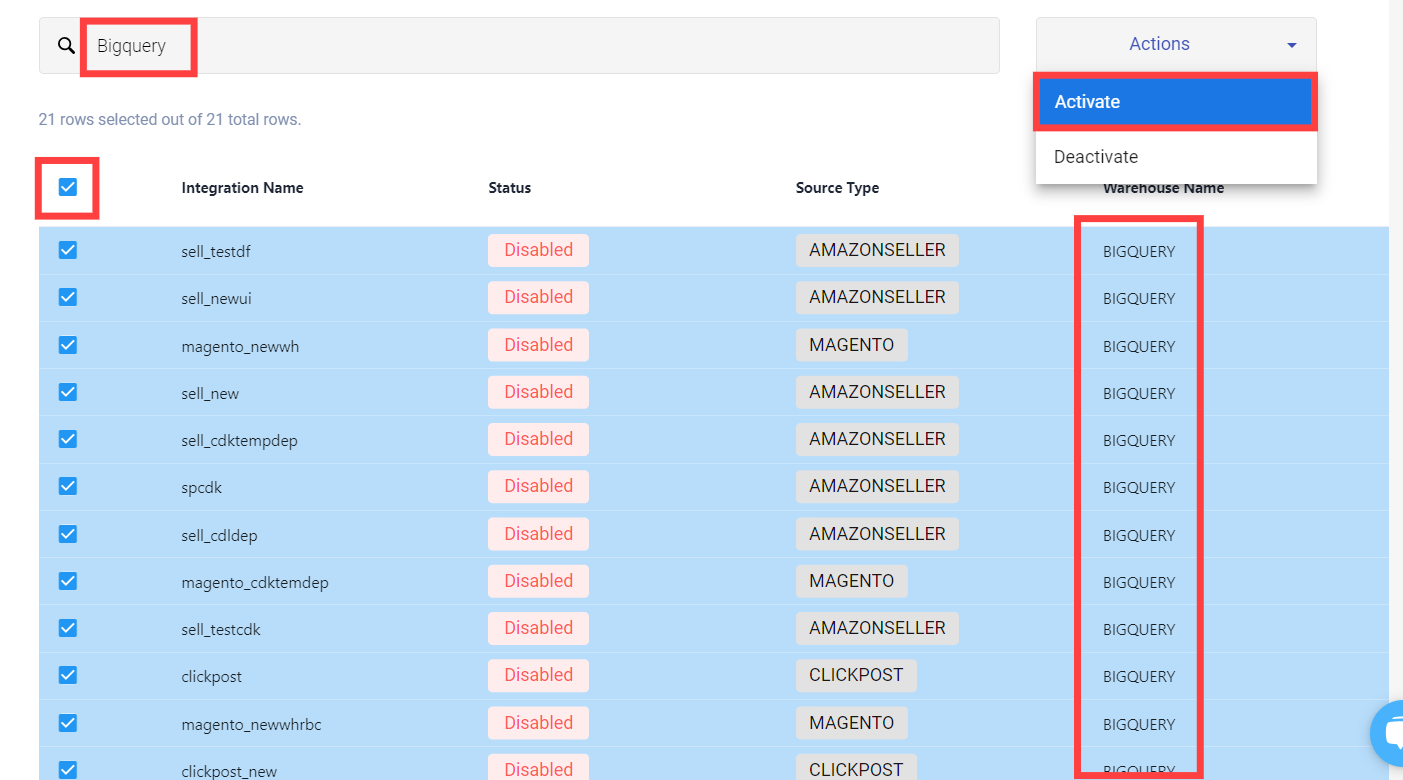
Filtering by Warehouse Type
This action is performed when you need Alert notifications for all the active integrations of a particular Warehouse Type.
- This can be performed by typing the desired Warehouse Type in the search box at the top of the Data Delay Tab on the Notification Settings page.

Filtering by Source and Warehouse Type
This action is performed when you desire Alert notifications of a specific Source Type that replicates data to another specific Warehouse Type.
- Provide the desired Source Type and Warehouse Type separated by one or multiple space(s) in the search box at the top of the Data Delay Tab on the Notification Settings page.

Filtering by Source Name as well as Source and Warehouse Type
Similar to the above if you have a range of Integration Names that have similar prefixes and desire to receive the Alert notifications, we can club them with the Source and Warehouse Type filter.
- Type out the initials of desired Integration Name, Source Type, and Warehouse Type separated by one or multiple space(s) in the search box at the top of the Data Delay Tab on the Notification Settings page.

Note:
- You can also use the combination of any two of Integration Name, Source Type, or Warehouse Type to create filters as you require.
- Do not forget to provide one or multiple space(s) between each of the entities.
Once you have filtered out the required integrations follow the following steps:
- Open the Actions dropdown and select Activate.
- You will receive a popup that says Status Changed Successfully and will observe the status updated as Enabled in the UI.
You will now receive real-time email notifications corresponding to these integrations and the same will be reflected in the Alerts panel.
Locate Alerts in the Daton UI
Alerts is an important feature in Daton that can be found right on the account dashboard.
-
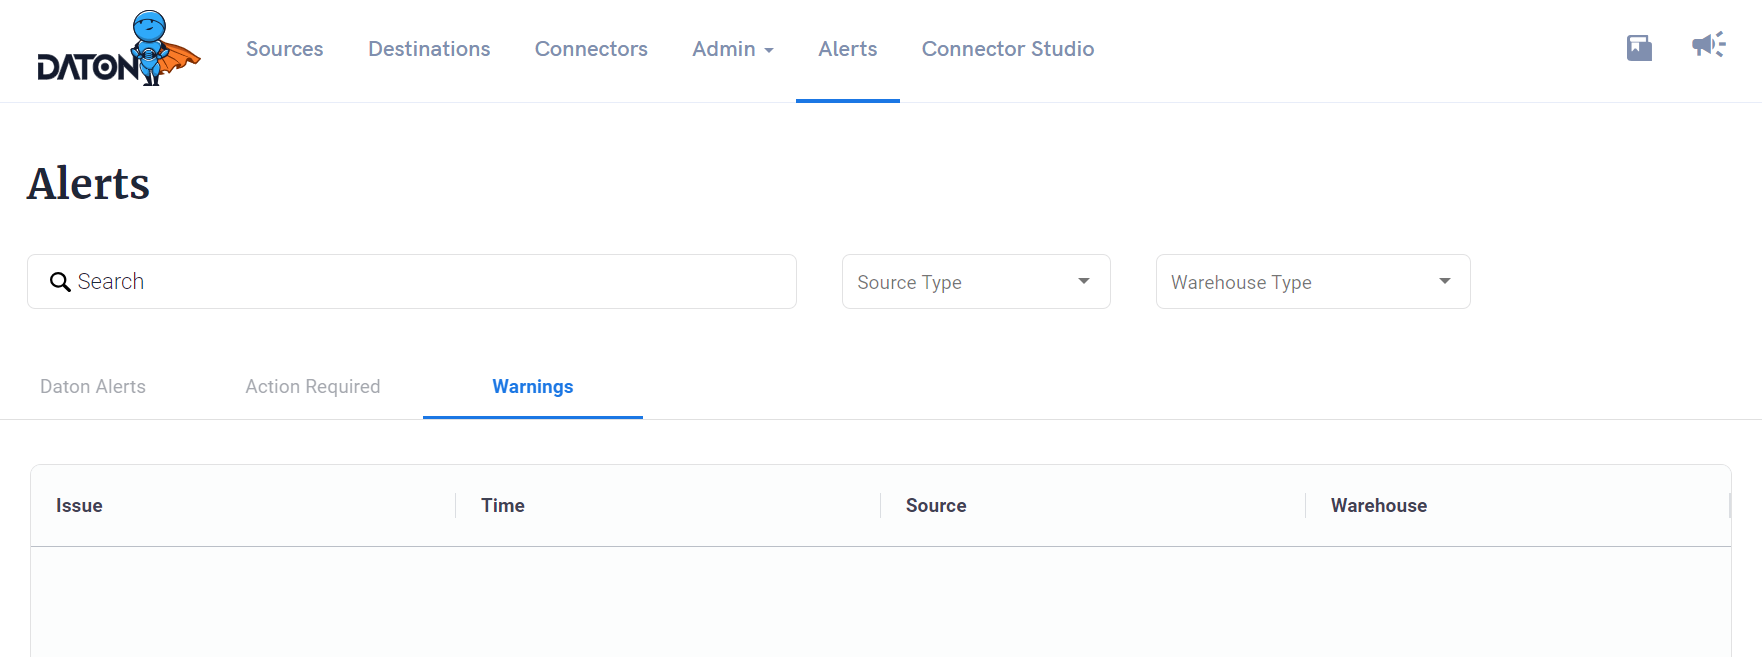
Log in to your Daton account. Locate and click Alerts on the top nav bar.

- You will be successfully redirected to the Alerts page in Daton.

- All your errors will be visible here based on their category!
Prerequisites for Effective Alert Functionality
To make the most of Daton's Alert functionality, it's important to ensure that certain requirements are configured. For optimized alert performance, make sure:
- your monitoring toggle is ON in the email preferences.
-
data delay is Enabled for your required integrations.
To know more about email preferences and data delay, read our article Notification Settings or watch the video below.
By meeting these requirements you'll be well-equipped to monitor and manage your Alerts effectively,
Resolving Alerts in Daton
In Daton, resolving alerts is a streamlined process, and it happens automatically when the underlying issues are addressed. Daton's system ensures that your Alerts page stays up to date, reflecting the current status of your integrations.
Steps to Ensure Correct Resolution:
- Review the Resolution detail of the alert to identify the specific issue.
- Take necessary actions to address the underlying problem as the resolution dictates.
- Keep an eye on the integration to monitor the sync status of tables.
- Once a table syncs successfully, Daton will promptly remove the associated error alert from the Alerts page.
Following these steps, you can seamlessly resolve alerts and maintain a well-functioning data integration environment in Daton.
Filtering your Alerts
In scenarios where you handle a substantial number of integrations, prioritizing specific ones to resolve alerts corresponding to particular issues, source types, or warehouse types can become challenging. Daton simplifies this process through its versatile filtering options, allowing users to efficiently navigate and address their priorities. Whether it's tracking specific error types, source types, or warehouse types, Daton's can filter the issues with precision.
Filter by Issue
This action is performed when you are in search of all the Alert notifications that share similar or the exact same issue.
- This can be performed by typing some words related to the issue in the search bar at the top of the Alerts page.


Filter by Source Type
This action is performed when you are in search of all the Alert notifications of a particular Source Type.
- This can be performed by selecting the desired Source Type from the Source Type dropdown at the top of the Alerts page.

Filter by Warehouse Type
This action is performed when you are in search of all the Alert notifications of a particular Warehouse Type.
- This can be performed by selecting the desired Warehouse Type from the Warehouse Type dropdown at the top of the Alerts page.

Please note that the versatility of filters does not end here, you can also use the combination of any of Issue, Source Type, or Warehouse Type to create filters as you require.
Note:
Although the images used for filters currently represent Daton alerts, the same logic applies to both the Action Required and Warnings tabs.
Using Daton's Alerts Panel, you can quickly identify and fix integration issues. It helps you prioritize your problems by letting you know what needs immediate attention (Action Required), what needs temporary attention (Warnings), and even what needs Daton's attention (Daton Alerts). In addition, the filters allow you to zoom in on specific problems, so you can focus your attention on the issues that matter most. It doesn't matter what table you're dealing with, Daton has your back.
